Viewing the Appliance Status
Using the ActivID Console, you can view the status of your ActivID Appliance.
View the Appliance Dashboard
The appliance Dashboard page is the default home page for the ActivID Console.
To access the Dashboard, under Appliance in the left menu, select Dashboard.
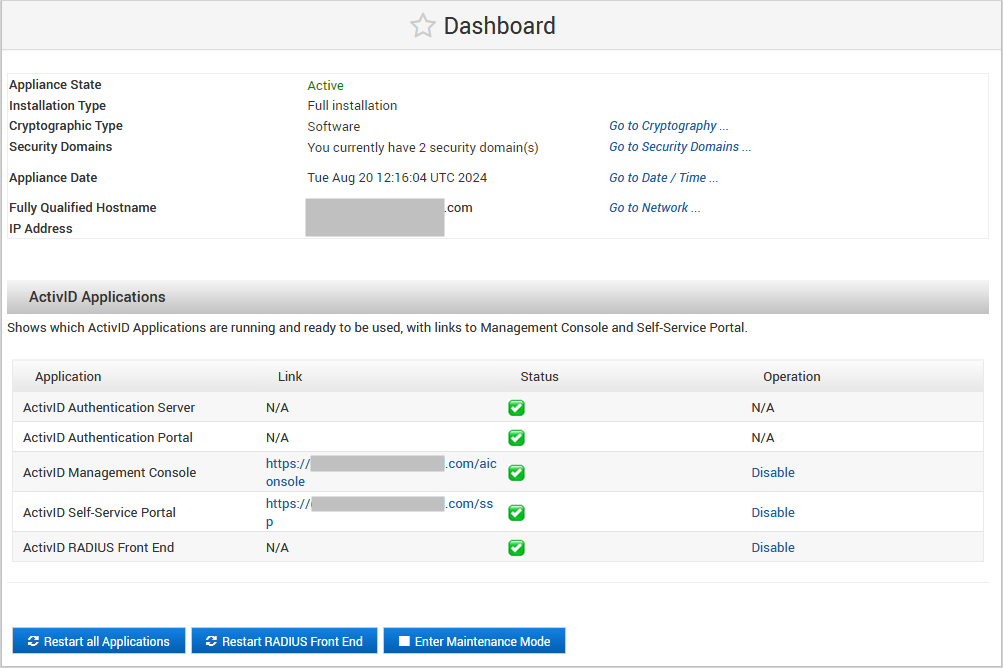
It provides an overview of the status of the appliance (if the appliance is functioning correctly, the state is Active) and the installed applications.
It also provides access to the ActivID Management Console and Self-Service Portal.
If appliance encounters an issue that requires your attention or action, notifications and alerts are displayed in the Dashboard:
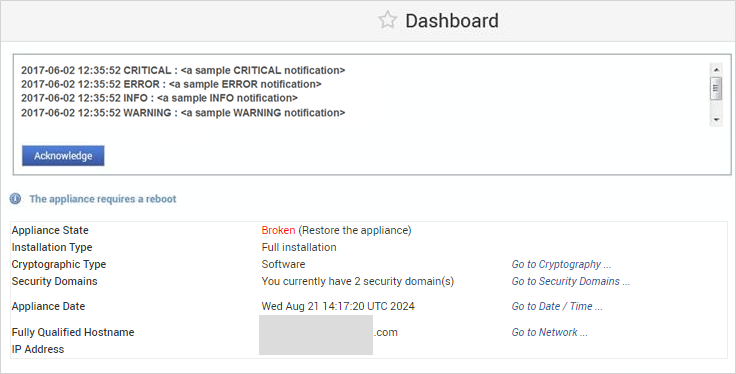
Notifications
Each notification includes the severity level and a description:
- INFO
- WARNING
- ERROR
- CRITICAL
After reviewing the displayed notifications, you can click Acknowledge to clear them.
Alerts
- Reboot alert – if the appliance needs to be rebooted, an alert is displayed above the status panel.
- Operational error - the appliance state is Broken and you must perform one of the following:
- Restore the appliance
- Revert to this Initial State of the virtual machine (appliance not configured)
View the System Information
Using the ActivID Console, you can view detailed system information.
In the left menu, select the System Information tab.
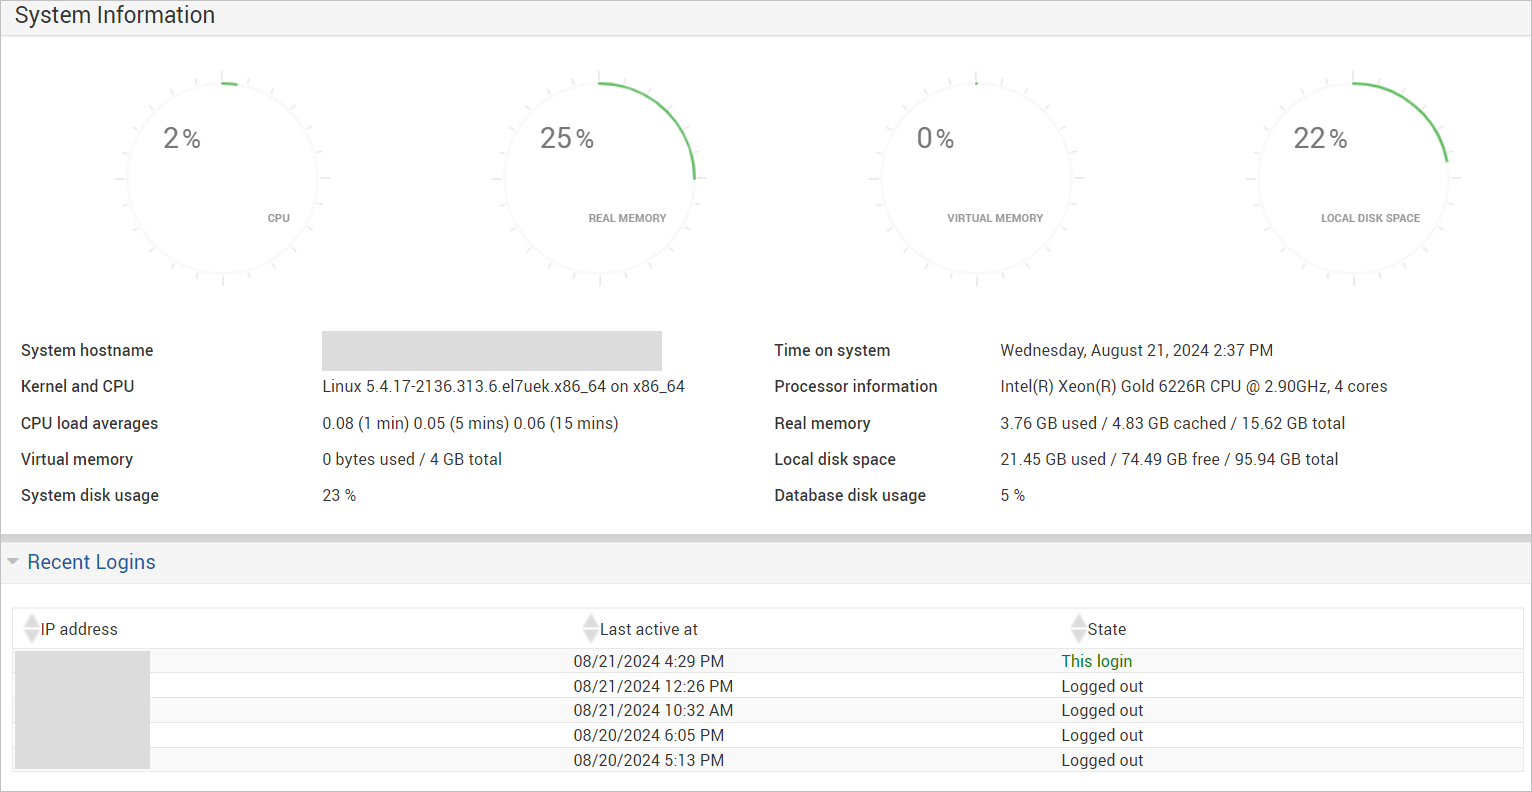
The System Information page provides a technical status of the appliance (including memory and disk space) and login history.
View the Disk Status on a Virtual Appliance
Using the ActivID Console, you can view the current status of the virtual appliance disks.
In the left menu, select the System Information tab.
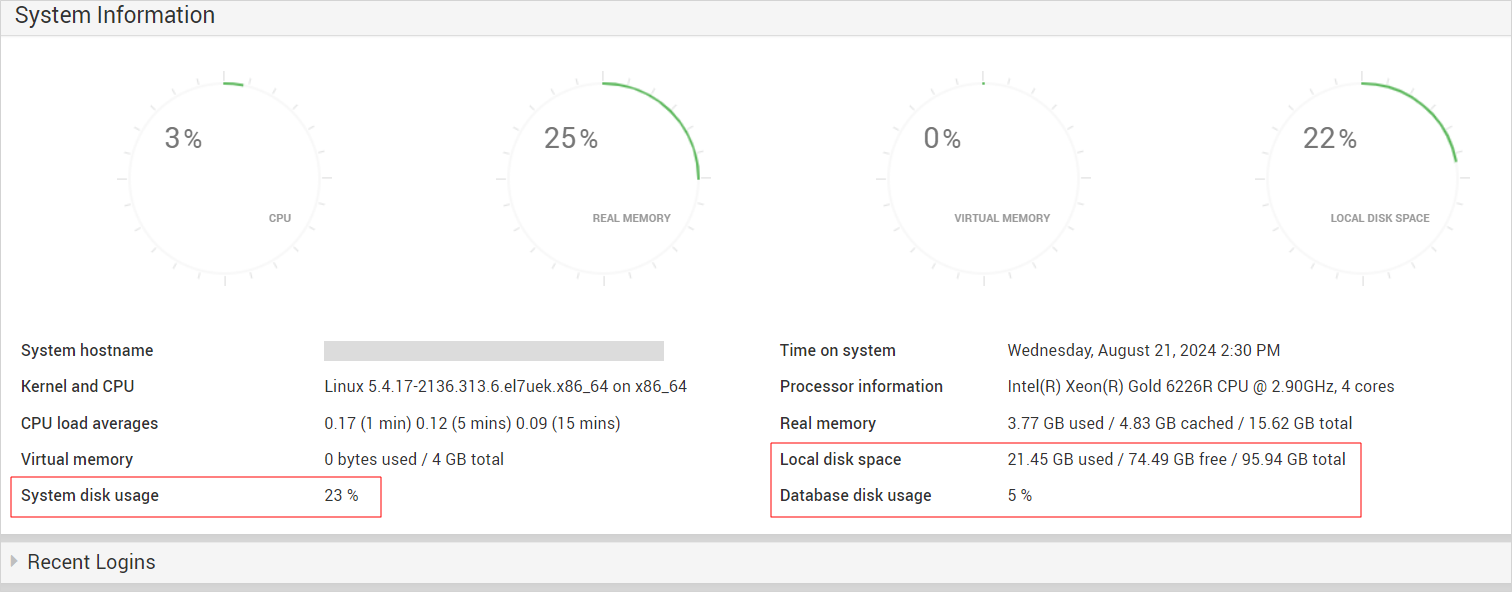
You can view the status of the:
-
System disk usage
-
Local disk space
-
Database disk usage


